Our contact mechanics and rubber friction models which we have developed in the past do need input on information such as surface roughness (in form of the surface roughness power spectrum) and material properties. Rubber-like materials are usually viscoelastic materials meaning that the material exhibits both viscous and elastic characteristics when undergoing deformation. The most important property of these viscoelastic materials is often referred to as the dynamic modulus. It is defined as the ratio of stress to strain under vibratory deformation. Because of the viscoelastic nature of the material, stress and strain are not in phase and hence it is a complex variable.
The complex viscoelastic modulus of rubber is usually studied experimentally using dynamic mechanical analysis (DMA) where an oscillatory force (stress) is applied to a material and the resulting displacement (strain) is measured (or vice versa). To calculate rubber friction it is in general necessary to know the viscoelastic modulus of the rubber material over many frequencies. However the responds of the rubber to a fixed strain or stress amplitude oscillation can only be measured as a function of a limited frequency interval. By repeating the procedure at different temperatures it is possible, due to time temperature shifting (TTS), to shift the different temperature segments together to a broader master curve.
This is usually done by the software of the DMA instrument, however we at Multiscale Consulting have developed our own shifting program. We do this in order to have full control over the shift method and to make sure that we don not use a black box software supplied from somewhere else. Also we are able to gather more information on the material directly from the measurement output supplied by the DMA instrument.
For example, we calculate the relaxation modulus and the inverse relaxation modulus to check the shifted master curve for conformity. When measuring the rubber material in the strain range where the response is independent of the applied strain (linear range) the complex elastic modulus is also a linear response function. One can then calculate the imaginary part from the real part using Kramer-Kronig relations. This can be done using our software and is used to quality control the measurements. In addition to measure the elastic modulus at low, fixed strain amplitudes at different temperatures we include the results of a couple of strain sweep measurements done at different temperatures in order to include the nonlinear behaviour of rubber in an approximate way.
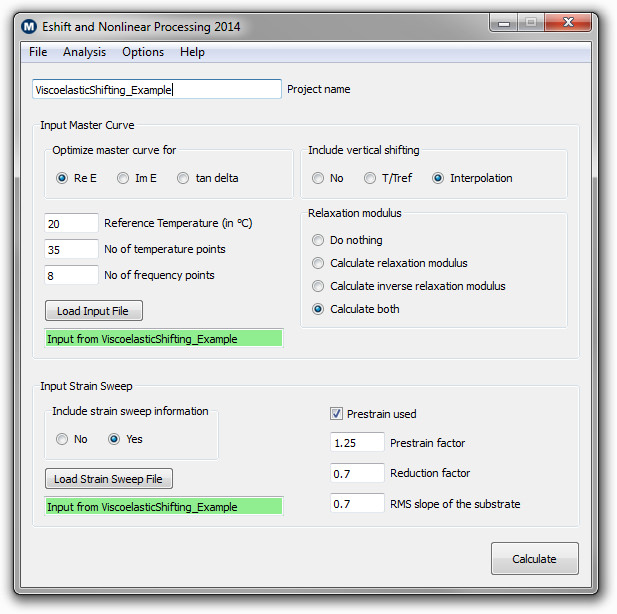
Below we show the main user interface of our Eshift and Nonlinear Processing software for Windows:
 |
Windows version of the power spectrum software
|
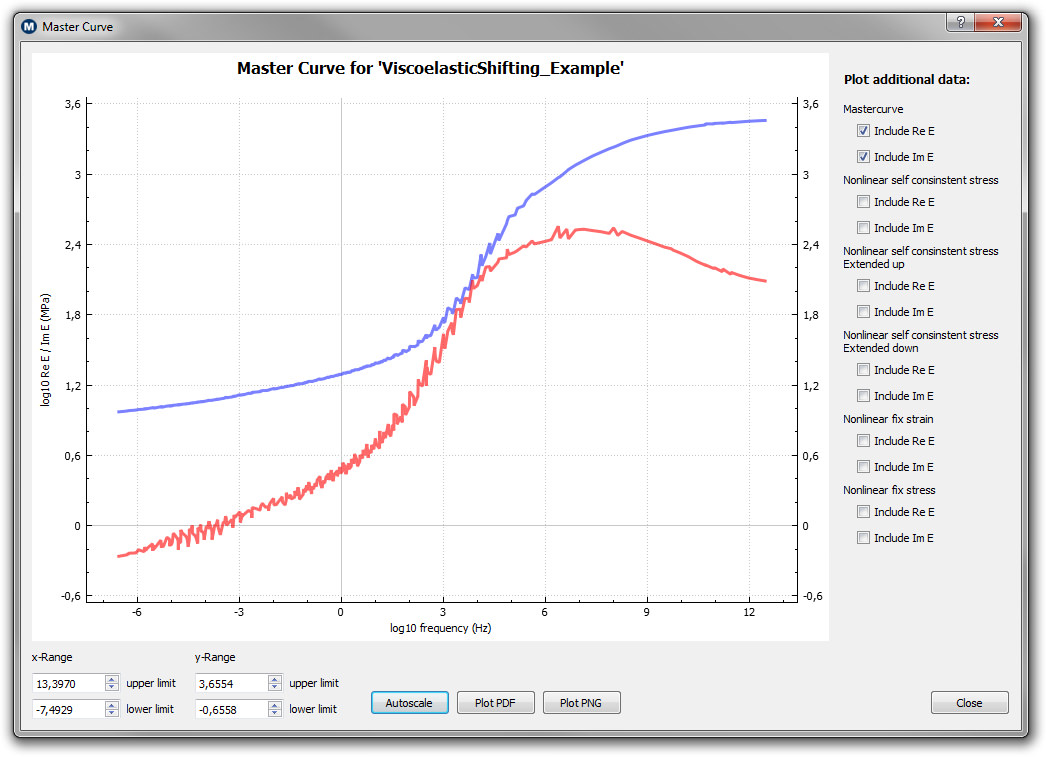
When the shifting is finished one can directly check the results to make sure that the master curves look reasonable. Below we show the real (blue) and imaginary (red) part of a measured rubber material after shifting the individual temperature segments to a broad master curve. Note the wide range of frequencies over which information on the material properties are available now.
 |
The real (blue) and imaginary (red) part of the complex, viscoelastic modulus
|
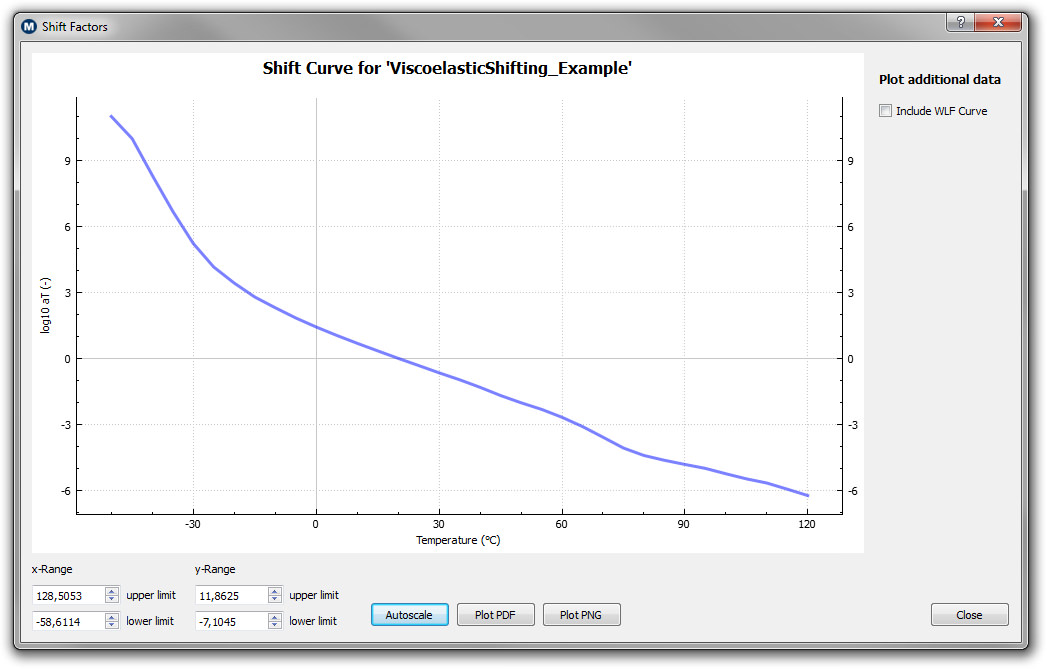
In addition to the complex viscoelastic modulus it is also very useful to check some other quantities in addition. Below on the left we show for example the horizontal shift factor aT used to shift the different temperature segments. Note that the shifting is not restricted to a particular way! Some people force a WLF shift function on the master curve which can lead to master curves which are noisy or discontinuous. Our software uses unrestricted shifting along the frequency axis (horizontal shifting) to obtain a master curve which is as smooth as possible.
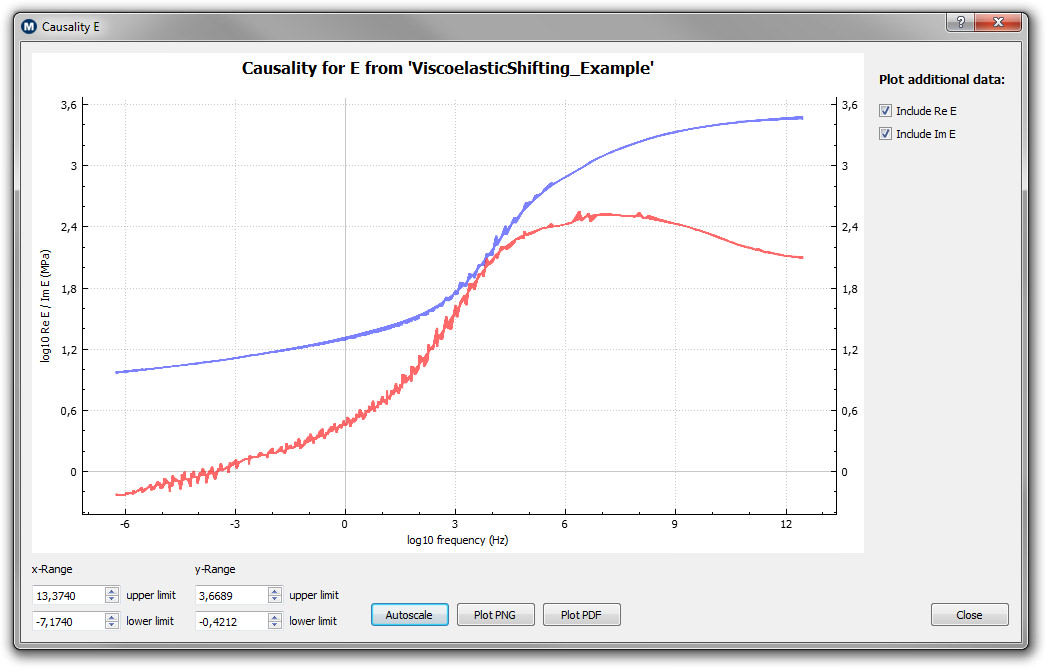
On the right we show the imaginary and the real part of the complex viscoelastic modulus including the results from the relaxation modulus calculation. The measured data basically overlaps with the calculated relaxation modulus so that one cannot distinguish between the two curves. This is a strong argument for that the measurement was done correctly and the experimental results are of high quality. This quality control ensures good material input for further contact mechanics and rubber friction calculations.
 |
 |
| The height probability distribution |
The slope probability distribution |
The program is with these information then capable of calculating a master curve at the strain value dominant in the application under investigation. The expected strain at the interface is iterated using the contact mechanics approach of Persson. The shifted master curve is then more representative for the contact problem that is considered.
For further information on the roughness generator please consider the following information:
| The manual of the Eshift and Nonlinear Processing software for the Windows version. |
Coming Soon |
| The Data.Out file is a summary of the different options chosen for a particular calculation. The options are briefly explained and the most important results summarized. The Data.Out file is always created after the calculation is finished. |
Download Data.Out |
| An example complex, viscoelastic modulus output file. |
Download Example Modulus |
| An example shift curve output file. |
Download Example Shift Curve |
In case you are interested in using the surface generator or you have further questions concerning the software please feel free to contact us.
affiliate tracking url | Men's Footwear


